Market Update | March 2026
The Big Story
Quick Take:
-
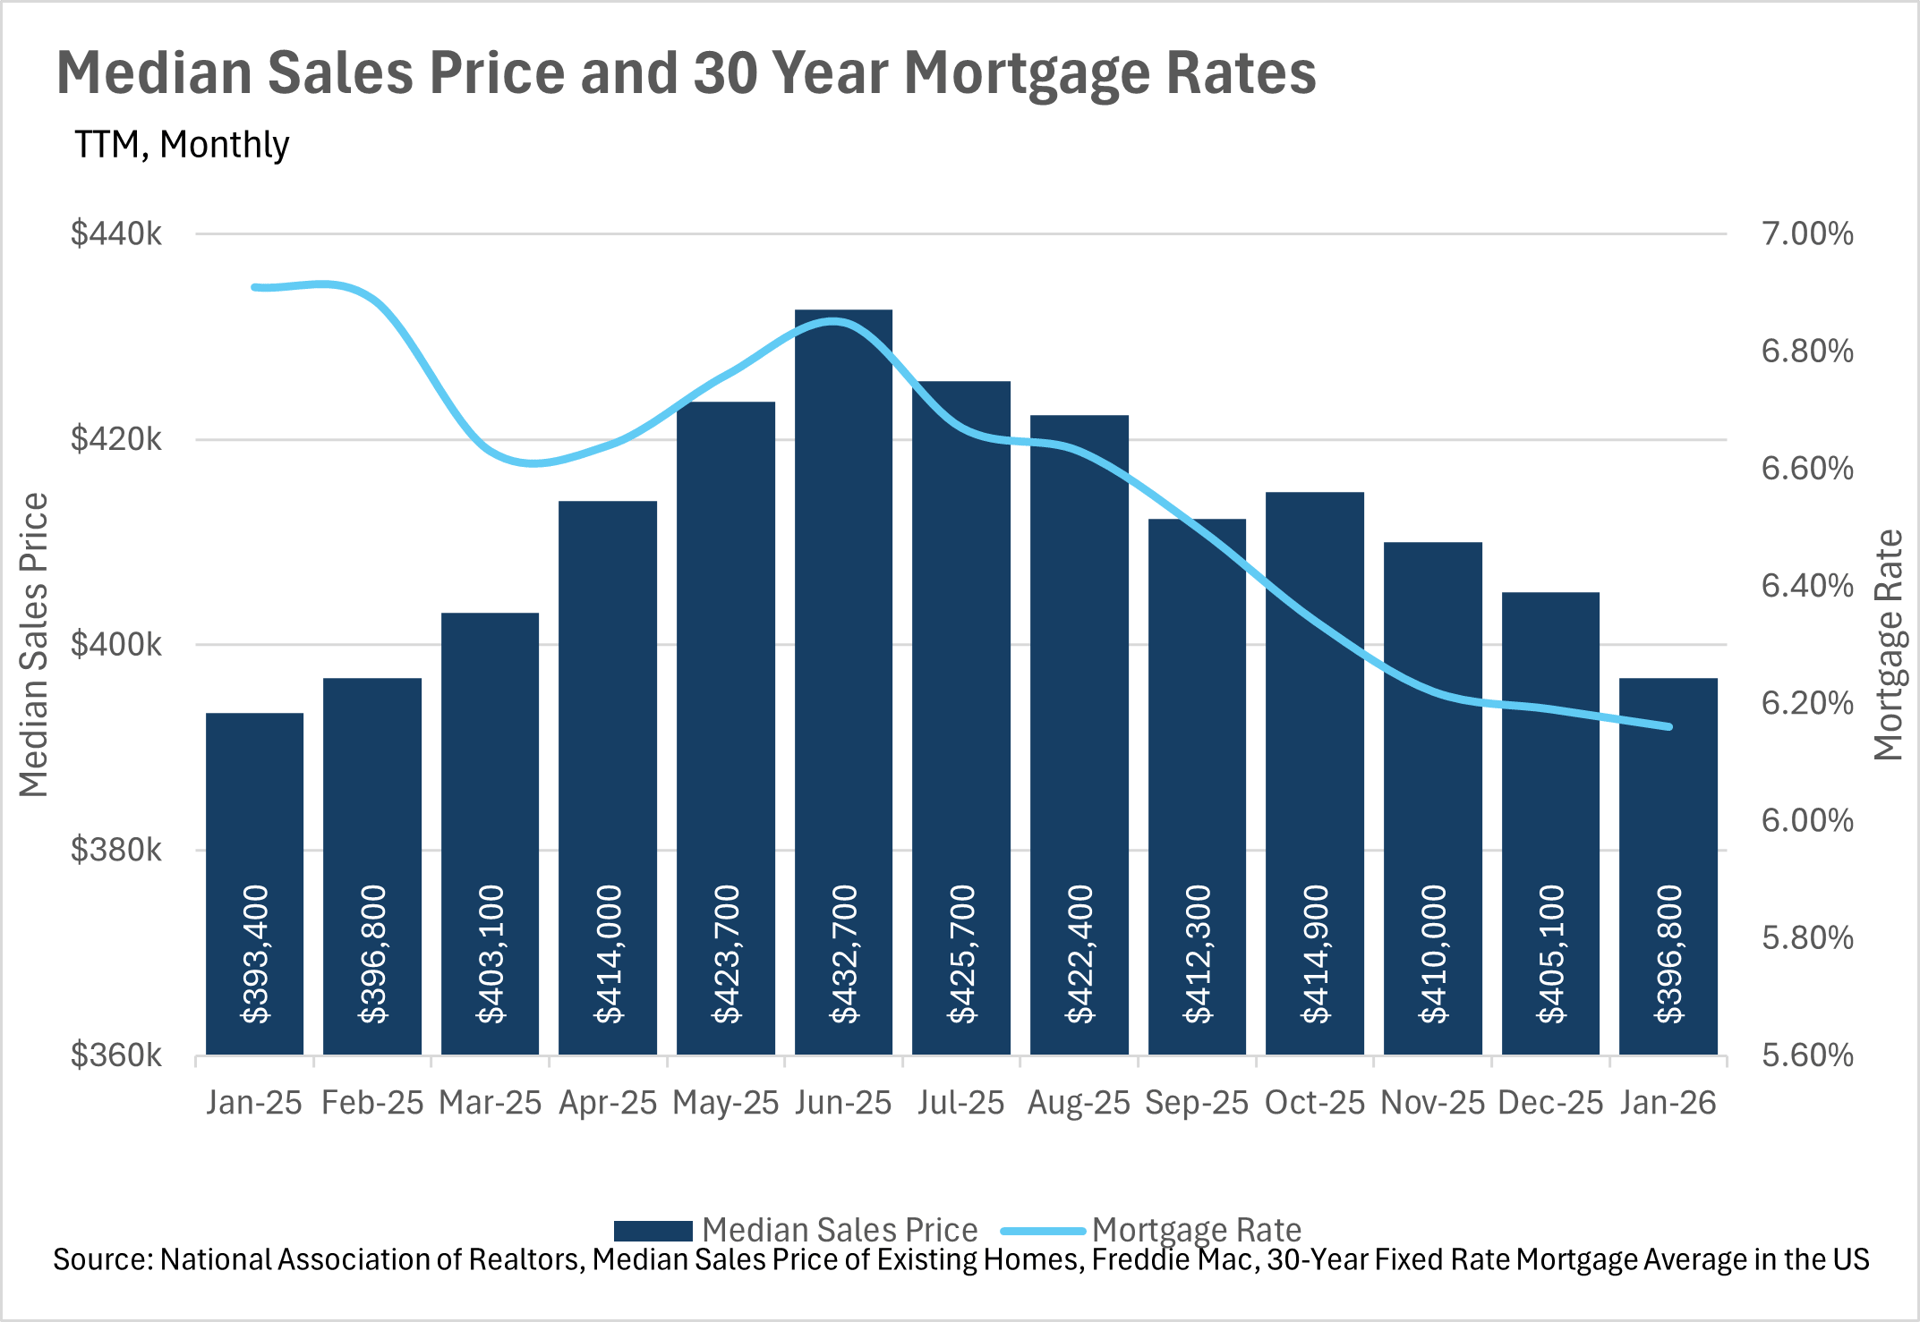
Median home sale prices are virtually flat on a year-over-year basis, as the market has settled into a holding pattern despite lower mortgage rates.
-
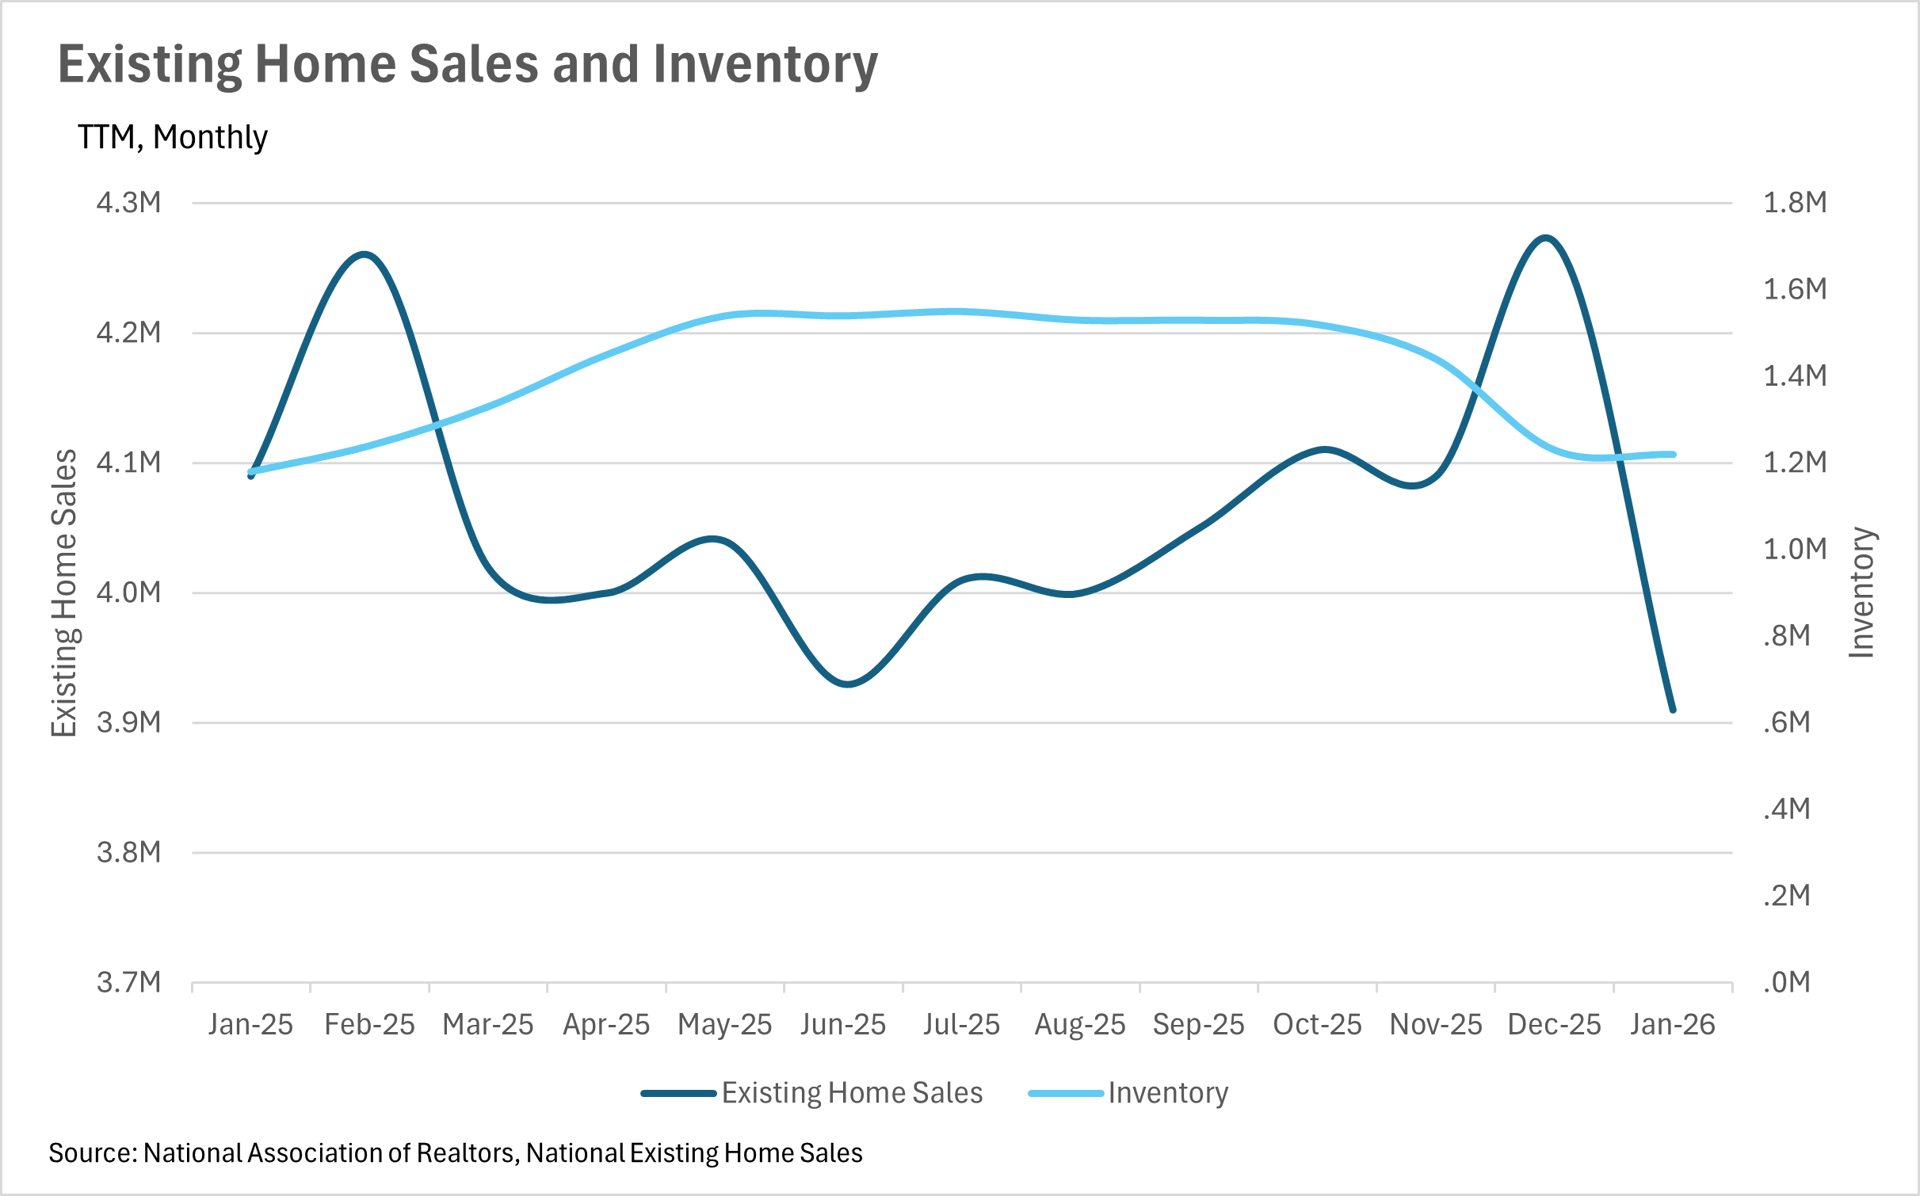
Inventory levels remain slightly elevated compared to last year, but the gap continues to narrow.
-
Existing home sales have pulled back on both a month-over-month and year-over-year basis, signaling that buyers are still waiting on the sidelines.
Note: You can find the charts & graphs for the Big Story at the end of the following section.
*National Association of REALTORS® data is released two months behind, so we estimate the most recent month's data when possible and appropriate.
Lower rates are finally making homeownership more affordable!
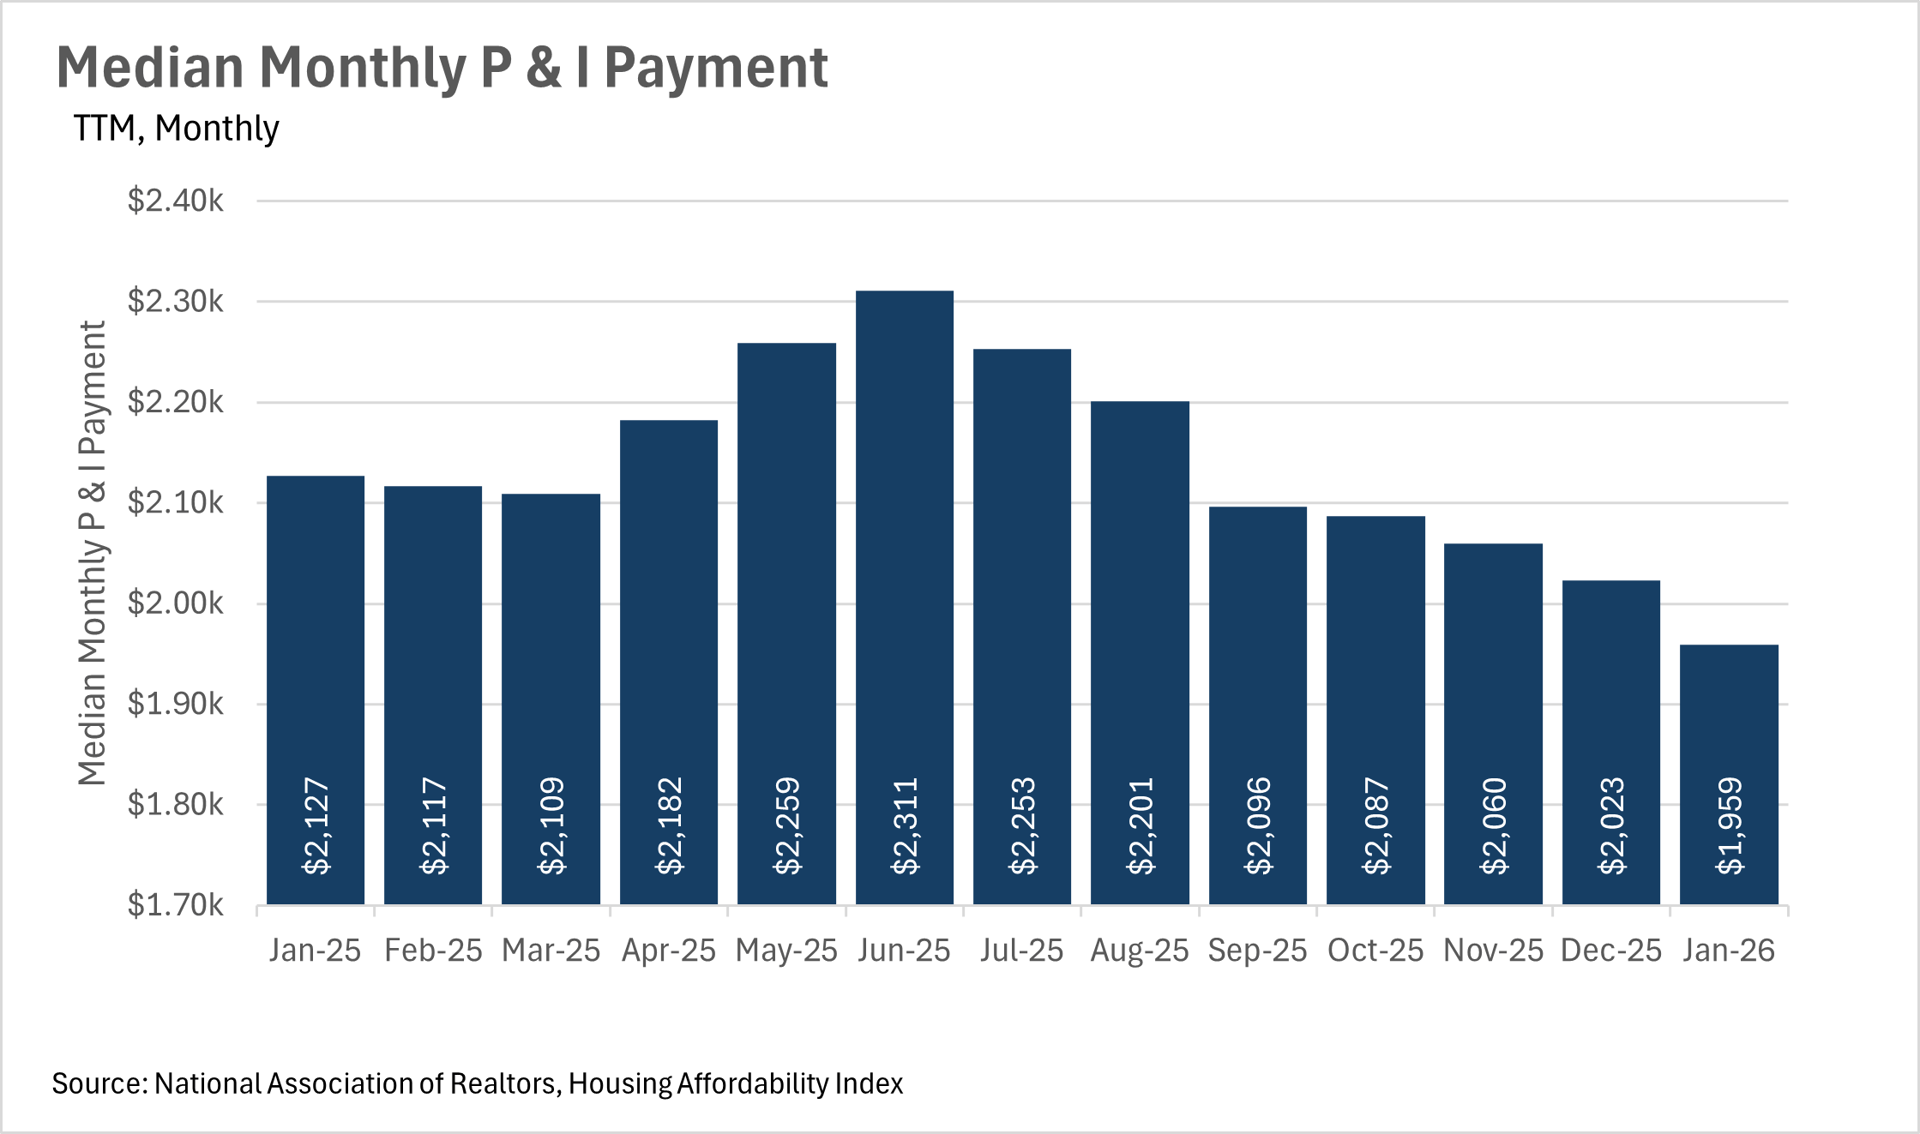
One of the biggest stories in the housing market right now is the continued decline in mortgage rates, and what that means for the average homebuyer's wallet. The average 30-year mortgage rate sat at 6.16% in January, representing a 10.85% year-over-year decline from the 6.91% we were seeing just a year ago. This decline in rates has had a direct impact on monthly payments, with the median monthly P&I payment coming in at $1,959 in January, down 7.90% from the $2,127 that the median homeowner was paying this time last year. That's roughly $168 per month in savings, which is great news for the average American.
One of the biggest stories in the housing market right now is the continued decline in mortgage rates, and what that means for the average homebuyer's wallet. The average 30-year mortgage rate sat at 6.16% in January, representing a 10.85% year-over-year decline from the 6.91% we were seeing just a year ago. This decline in rates has had a direct impact on monthly payments, with the median monthly P&I payment coming in at $1,959 in January, down 7.90% from the $2,127 that the median homeowner was paying this time last year. That's roughly $168 per month in savings, which is great news for the average American.
However, despite the fact that rates have come down substantially, the median home sale price has remained remarkably stable, coming in at $396,800 in January. This represents just a 0.86% increase on a year-over-year basis, and a 2.05% decline from December. It seems like the market has found a bit of equilibrium, as lower rates are being offset by cautious buyers who aren't quite ready to jump back in just yet.
New listings are ticking up as we head into the spring
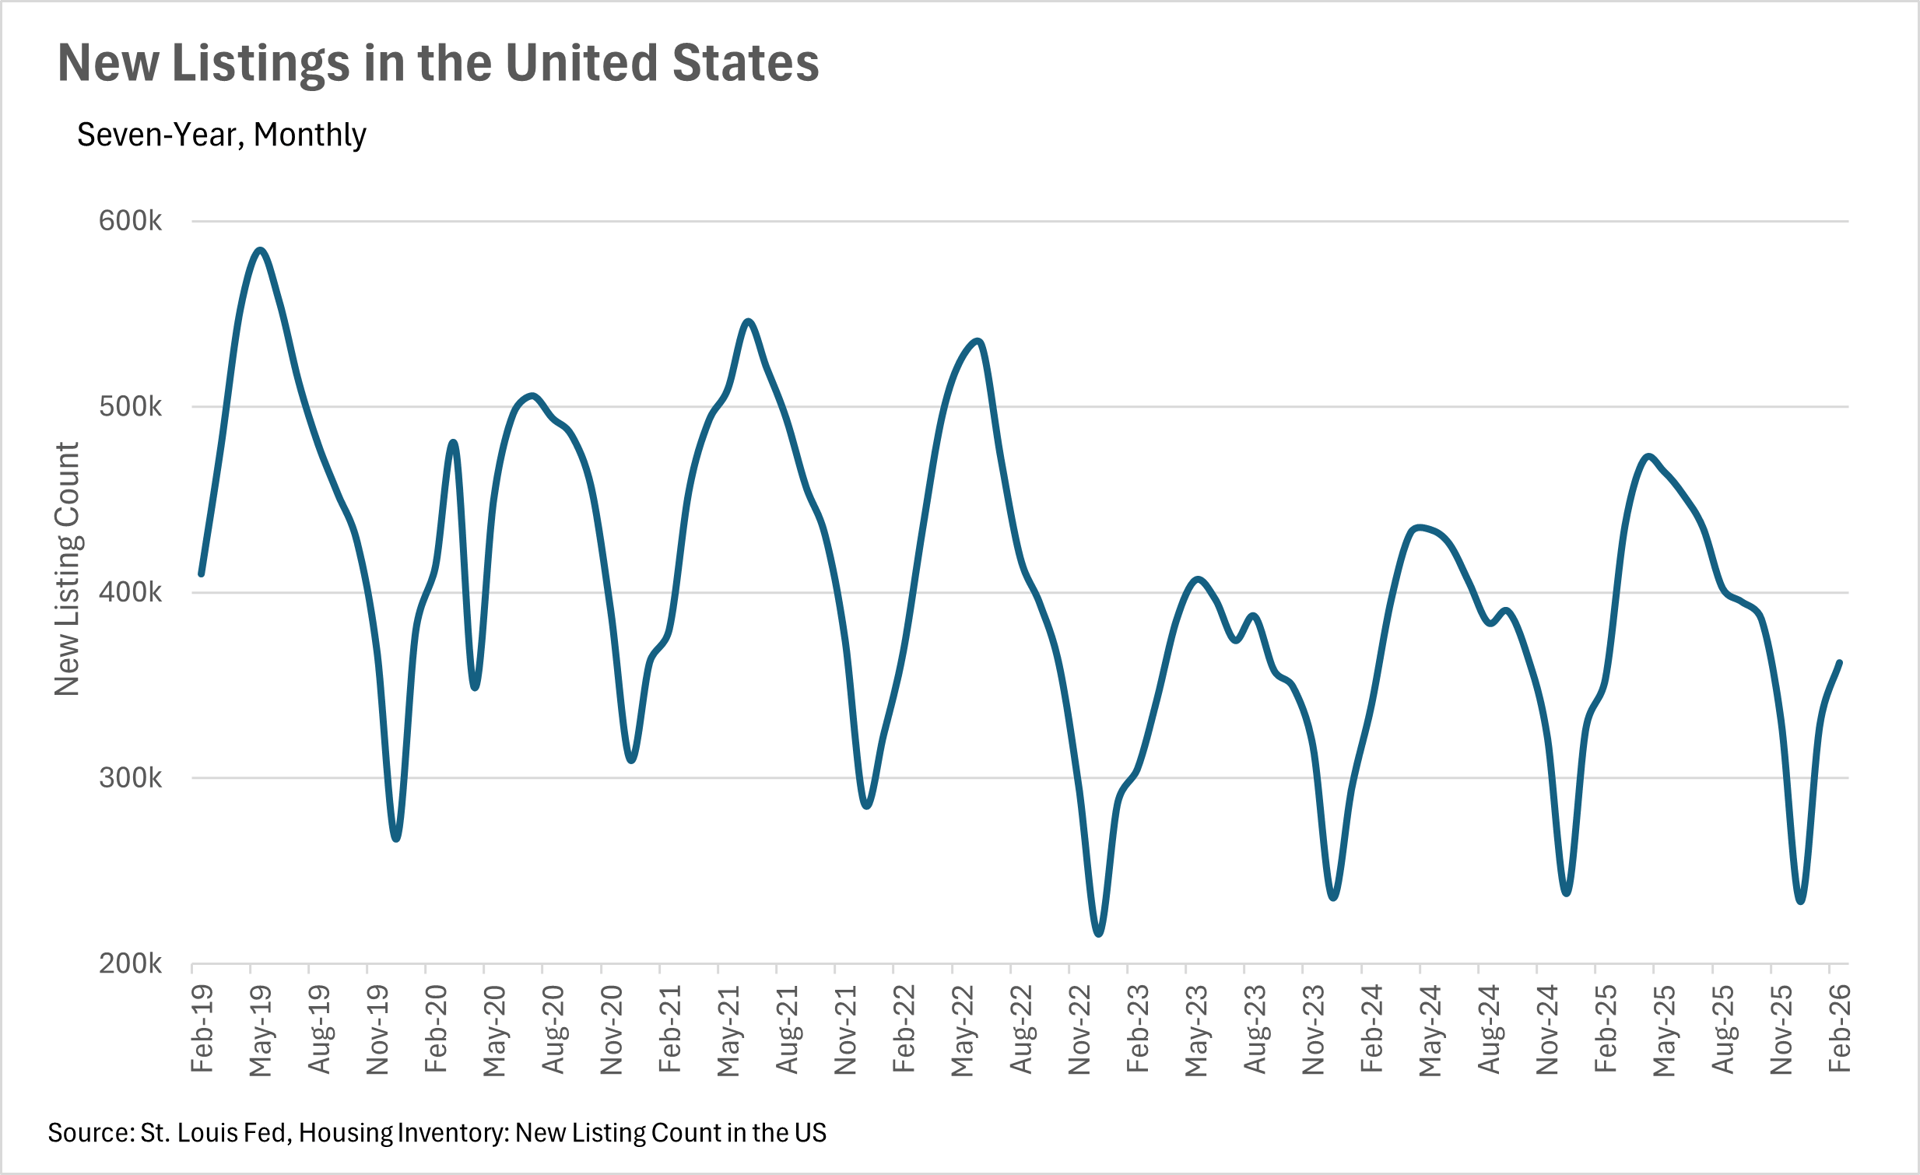
As we move out of the seasonally slow winter months, we're starting to see new listings pick up, which is a great sign for the market heading into the spring. In February, there were 362,180 new listings that hit the market, representing a 2.41% year-over-year increase and a 10.01% month-over-month increase. This uptick in new listings is encouraging, as it suggests that homeowners are starting to feel more comfortable putting their homes on the market. On the inventory side, there were 1,220,000 homes available for sale in January, which is up 3.39% on a year-over-year basis. While this is certainly a step in the right direction, it's worth noting that inventory levels are still well below the levels we need to see in order for the market to truly become balanced. That said, the combination of rising new listings and modestly higher inventory levels should give buyers a few more options to choose from as we head into the busier spring months.
Buyers are still taking their time on the sidelines
Despite the fact that mortgage rates have come down by nearly 11% on a year-over-year basis, buyers are still being cautious. In January, existing home sales came in at 3,910,000, representing a 4.40% decline on a year-over-year basis and an 8.43% decline from December. This tells us that while the affordability picture has improved quite a bit, many buyers are still waiting for rates to come down even further before they make their move. It's also worth considering that the seasonal slowdown plays a role here, as January is historically one of the slower months for home sales. As we move into the spring and summer, it'll be worth keeping a close eye on this metric to see if the lower rates and increasing inventory levels are enough to bring buyers off the sidelines.
A market that could go either way in the coming months
Right now, the national market is in an interesting position. Inventory levels are slightly higher than they were last year, but existing home sales have declined, which means that the supply of homes on the market is lasting a bit longer than it was at this time last year. With new listings beginning to pick up heading into the spring, and buyers still largely sitting on the sidelines, we could see inventory continue to build in the coming months. However, if mortgage rates continue to trend downward, that could be the catalyst that brings buyers back into the market in a big way. As always, real estate is a highly localized asset, which is why you should check out what's going on in your local market below in the Local Lowdown!
The Local Lowdown
Quick Take:
San Francisco is surging while prices pull back in the North Bay
February brought a wide range of price action across the Bay Area, highlighting just how localized real estate trends can be. San Francisco led the way with a remarkable 21.41% year-over-year increase in single-family home median sale price, with the median home selling for $1,942,500. Condos in San Francisco also had an exceptional month, climbing 11.87% to $1,225,000. In the East Bay, Alameda County's median single-family home price returned to the $1,300,000 mark, essentially flat year-over-year, while Contra Costa County saw a modest 3.23% decline to $810,000.
Silicon Valley was a mixed bag, with Santa Clara County posting a slight 0.63% gain to $2,000,000, while San Mateo County dropped 8.24% to $1,950,000. The North Bay experienced the most widespread weakness, as Napa County single-family homes fell 20.86% to $840,500 and Marin County declined 5.74% to $1,602,500. Across the region, the condo market continued to struggle, with declines in most counties, though Contra Costa County was a notable exception, posting a 17.68% year-over-year increase.
The Bay Area's inventory crisis shows no signs of easing
Inventory levels across the Bay Area remain far below where they were a year ago, and the situation has only intensified as we head into the spring selling season. The North Bay is experiencing the most dramatic squeeze, with single-family home inventory down a staggering 47.88% year-over-year and condo inventory down 38.71%. San Francisco is not far behind, with single-family inventory down 37.45% and condo inventory down 38.81%, leaving fewer than 550 homes available for sale in the entire city.
The East Bay has seen single-family inventory decline by 21.24% and condo inventory drop by 14.40%. Silicon Valley rounds out the picture with single-family inventory down 12.11% and condo inventory down 7.05%. New listings are beginning to pick up in some areas as the spring market gets underway, but they remain well below last year's pace in most markets. This persistent shortage of available homes is keeping upward pressure on prices in many areas and creating a challenging environment for buyers who are ready to make a move.
Single-family homes are flying off the shelves, but the condo market is a different story
The pace of sales for single-family homes across the Bay Area is nothing short of remarkable. In Santa Clara County, the average home is selling in just 8 days, while San Mateo County homes are moving in 11 days. San Francisco single-family homes are selling in just 12 days, and East Bay listings are closing in under two weeks in both Alameda and Contra Costa Counties. These figures underscore just how competitive the single-family market remains. The condo market, however, continues to show signs of a much slower pace.
Santa Cruz County condos are taking an average of 84 days to sell, a staggering 546.15% increase compared to February 2025. San Mateo County condos are spending 64.29% more time on the market year-over-year, and Santa Clara County condos are up 21.43%. In the North Bay, Marin County condos saw days on market spike by 231.25% on a year-over-year basis. The divergence between single-family homes and condos remains one of the most defining characteristics of the current Bay Area market.
Sellers hold the cards as the spring market heats up
When determining whether a market is a buyers' market or a sellers' market, we look to the Months of Supply Inventory (MSI) metric. The state of California has historically averaged around three months of MSI, so any area with at or around three months of MSI is considered a balanced market. Any market that has lower than three months of MSI is considered a seller's market, whereas markets with more than three months of MSI are considered a buyers' market.
When determining whether a market is a buyers' market or a sellers' market, we look to the Months of Supply Inventory (MSI) metric. The state of California has historically averaged around three months of MSI, so any area with at or around three months of MSI is considered a balanced market. Any market that has lower than three months of MSI is considered a seller's market, whereas markets with more than three months of MSI are considered a buyers' market.
The single-family home market is firmly in seller's territory across virtually the entire Bay Area. San Francisco sits at just 0.8 months of supply, while Santa Clara County and San Mateo County each have 1.1 months. Marin County has 1.2 months of supply, down an incredible 68.42% year-over-year. Alameda County sits at 1.4 months, Contra Costa County at 1.7 months, Sonoma County at 1.8 months, and Solano County at 2 months. Even Santa Cruz County, which has historically been more balanced, has tightened to just 2 months of supply. The condo market is a bit more balanced, with several counties hovering right around the three-month threshold. Alameda County has 3.3 months of condo supply, Contra Costa County has 3.2 months, and Sonoma County has 2.9 months. However, Napa County remains a buyer's market at 4 months of condo supply, and Santa Cruz County sits at 3.6 months. As we head deeper into the spring selling season, sellers across most of the Bay Area remain firmly in the driver's seat.